

Welcome to NAEEM Brokerage
Our clients can place orders in the market real time, check portfolios anytime, anywhere, get live stock quotes, customize watch lists, access market news and track indices. We are well-known for our technical analysis daily reports and the associated Technical Tracker monthly report.


NAEEM Share Price
| Open | Last | Chng % | High | Low | Highest | Lowest | Volume | Value | Trades Count |
|---|---|---|---|---|---|---|---|---|---|
| 0.20 | 0.19 | -5.00 % | 0.19 | 0.19 | 0.67 | 0.28 | 205 | 716 | 3 |
Block Trades
| Share Name | Qty. | Value EGP | Count |
|---|---|---|---|
| Cairo Investment And Real Estate Development | 2,819,791 | 33,837,492 | 3 |
| Cairo Investment And Real Estate Development | 2,819,791 | 33,837,492 | 3 |
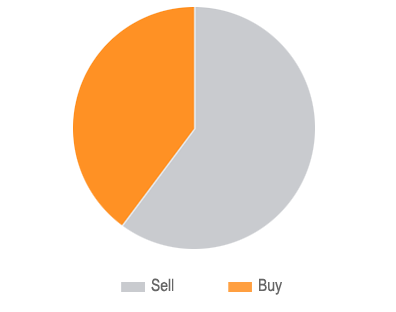
Money Flow
Economical Data
Currency Exchange Rates
Commodities
| Dollar / EGP | Euro / EGP | Euro / Dollar |
|---|---|---|
| 819, | 2,8191 | 33,83792 |
| Gold | Copper | Oil |
|---|---|---|
| 5654 | 2,819,791 | 33,837,492 |
Macroeconomic Indicators
| 364-Day T-Bills, Weighted Avg. | 2,8191 |
| Interest rate | 2,8191 |
| Foreign Reserves Bn USD | 2,8191 |
| 364-Day T-Bills, Weighted Avg. | 2,8191 |
| 91-Day T-Bills, Weighted Avg. | 2,8191 |
| Foreign Reserves Bn USD | 2,8191 |
| 364-Day T-Bills, Weighted Avg. | 2,8191 |
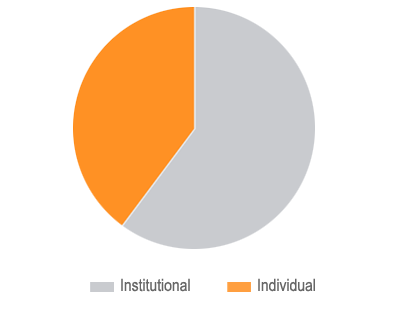
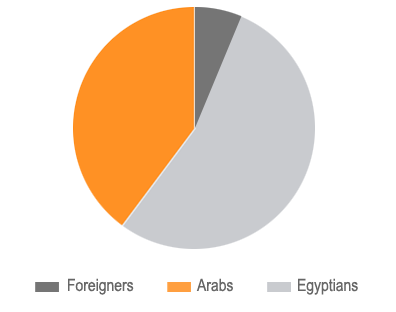
Investors
| Egyptians | Arabs | Foreigners | ||||
|---|---|---|---|---|---|---|
| Trade | Ret. | Inst. | Ret. | Inst. | Ret. | Inst. |
| Buy (M) | 5.4 | 8.3 | 3.83 | 5.4 | 8.3 | 3.83 |
| Turnover (M) | 5.4 | 8.3 | 3.83 | 5.4 | 8.3 | 3.83 |
| Buy (M) | 5.4 | 8.3 | 3.83 | 5.4 | 8.3 | 3.83 |
| Turnover (M) | 5.4 | 8.3 | 3.83 | 5.4 | 8.3 | 3.83 |
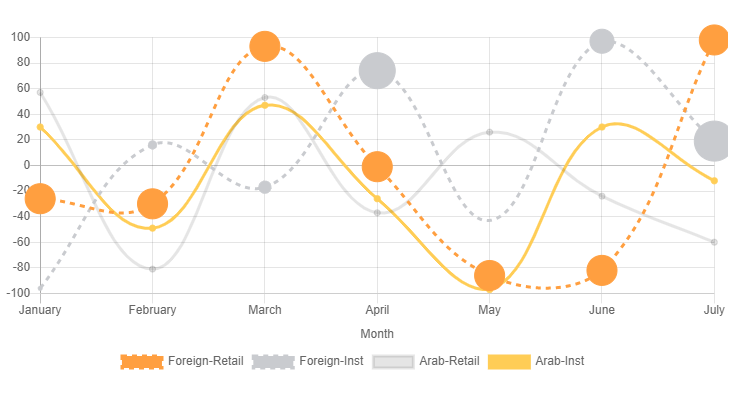
Today's Investors Distribution
Key Indicators
| Latest | Reference | Previous | Range | ||
|---|---|---|---|---|---|
| GDP Growth Rate | 5.4 | Mar/2022 | 8.3 | -3.80:13.77 | Percent |
| Unemployment Rate | 5.4 | Mar/2022 | 8.3 | -3.80:13.77 | Percent |
| Inflation Rate | 5.4 | Mar/2022 | 8.3 | -3.80:13.77 | Percent |
| Interest Rate | 5.4 | Mar/2022 | 8.3 | -3.80:13.77 | Percent |
Sector Ranking By Activity
| Sector Name | T/O(Mn) | Mkt % |
|---|---|---|
| Real Estate | 0.19 | -5.00 % |
| Banks | 0.19 | -5.00 % |
| Non-bank financial services | 0.19 | -5.00 % |
| IT , Media & Communication Services | 0.19 | -5.00 % |
| Non-bank financial services | 0.19 | -5.00 % |
| IT , Media & Communication Services | 0.19 | -5.00 % |
| COMI | 0.19 | -5.00 % |
| COMI | 0.19 | -5.00 % |
| COMI | 0.19 | -5.00 % |
| COMI | 0.19 | -5.00 % |